Fresh February Audience Gains Reported by Nielsen
Nielsen PPM data for February 2022 reports radio's weekly reach at 119.3 million. February weekly cume is up +3.4M year-over-year, with every reported demo at-or-above levels from last year. AQH levels are up across various demos as well, with the highest YoY growth seen among Black Americans (+8%), Hispanics (+3%), and Persons 35-64 (+3%).
Click gray circle to enlarge chart.
DRIVE TIMES LEAD DAYPART GAINS YEAR-OVER-YEAR
February's AQH growth is seen throughout the day, with strong performance from all dayparts. Drive times show the most growth over last year, with +11% growth for AMD, up +900K, and +5% for PMD, up +500K.
Click gray circle to enlarge chart.
Cities and states across the country are seeing progress towards normalcy in terms of mandates, work patterns, and consumer behaviors. Nielsen's PPM updates continue to show that radio listening is normalizing along with it. Last February showed improvements over the pandemic-low of April 2020, and this February produced even more growth over last year.
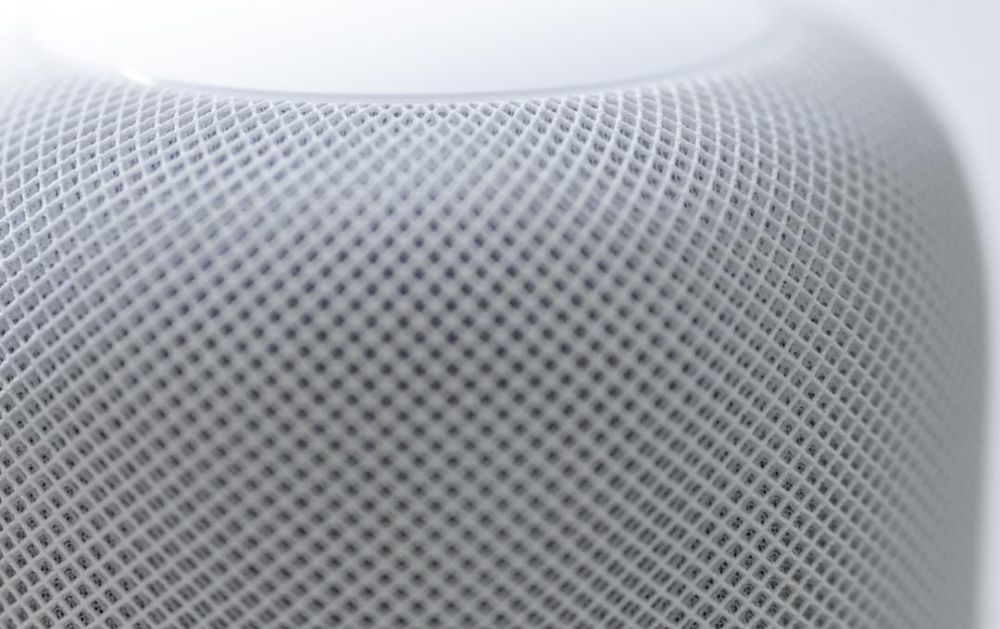
Smart Speaker Trend: More Owners and More Devices
THE INFINITE DIAL TRACKS SMART SPEAKER GROWTH
Edison Research, along with partners Wondery and ART19, released a new edition of the Infinite Dial, exploring all facets of the audio landscape. This year's release was fielded in January 2022, and reflects the evolving mindsets and behaviors that arose during the COVID-19 pandemic. One area of continued growth is the adoption and accumulation of smart speakers.
An estimated 100 million consumers, more than one-third of the U.S. population over 12, now own a smart speaker. That marks an increase of +6% over last year, and a total of +30% since the onset of the COVID-19 pandemic. Smart speakers saw an initial jump in adoption during the first year of the pandemic, and the new Infinite Dial data is evidence that consumer interest continues to grow.
Click gray circle to enlarge chart.
Not only are more consumers buying smart speakers, they are also increasing the number of units in each household. As of this year, about 6 in 10 smart speaker owners have more than one device, a +79% increase over 2018. The number of households that own 3+ devices has remained stable over the past 3 years at about one-third. The multiple devices reflect that consumers who invest in a smart speaker are finding more use cases for it, creating a desire for multiple devices.
Click gray circle to enlarge chart.
OTA + SMART SPEAKERS PROVIDE STABLE ACCESS TO AM/FM CONTENT
One such use case for smart speakers is listening to AM/FM Radio. Over-the-air radio still dominates overall AM/FM listening, thanks in large part to the automobile, but smart speakers are providing consumers with more ways to connect with their favorite local AM/FM stations at home and work. Trends are showing that the number of households with physical radios is declining, but consumers are not losing access to AM/FM content. When smart speakers are included in the count, the number of consumers with access to AM/FM content is stable at about 75%.
Click gray circle to enlarge chart.
Consumers have more ways than ever to connect with their favorite local AM/FM stations at home and work. Marketers, in turn, have even more ways to reach them - on radio station streams and OTA.
For more information from the Infinite Dial.
Local Audio Ad Spend to Increase in 2022 and Beyond
BIA FORECASTS $173.3B IN LOCAL SPEND FOR 2022
BIA Advisory Services forecasts local ad revenue across all media to reach $173.3B in 2022, up +11.4% from 2021. Growth is expected to occur throughout 2022 as key economic drivers such as employment, consumer confidence, and office reopenings create favorable conditions. BIA predicts that all geographic regions of the U.S. will surpass 2019 spending this year, despite lingering hindrances of omicron variants, supply chain issues, and inflation.
LOCAL AUDIO FORECAST TO REACH $14.4B
The audio portion of total local ad spend is forecast to reach $14.4B in 2022, making up 8.3% of the local pie. 79% of the audio spend, or $11.4B, will come from Radio OTA - which incorporates all revenues generated by local radio stations' OTA broadcasts (excluding any advertising sold by the national radio networks). Radio Digital will make up 17% of total local audio spend with $2.5B. Radio Digital is defined by BIA as all revenues generated by local radio stations' online activities from advertisers targeting a local market. It includes display and streaming advertising revenue. The remaining $600M in BIA's local audio forecast is Pandora's revenue from local market-targeted ads.
Click gray circle to enlarge chart.
LOCAL RADIO SPENDING TO HIT $15B BY 2026
Local radio spend (OTA and Digital) is forecast to increase +9% over the next 5 years to $15B. Radio OTA spend will remain relatively stable through 2026, with increases seen during Political years. At the same time, Radio Digital spend will experience strong growth, increasing +44% to $3.6B. AM/FM Radio stations stand to benefit from advertisers' growing local Digital Radio spend to increase their sales.
Click gray circle to enlarge chart.
VERTICALS LEADING IN LOCAL AUDIO INVESTMENT
BIA predicts that Insurance brands will spend over $700M in local audio, making it the #1 sub-vertical for audio advertisers in 2022. Another $700M in revenue will come from the nebulous "Other" category, including all of the extraneous verticals not part of BIA's named categories. The next nearest sub-vertical is QSR/Fast Foods, with brands spending nearly $600M. Wireless Communications and Investments & Retirement Advice follow, with spend over $500M. The rest of the Top 10 list are predicted to spend well over $400M in local audio and include Supermarkets, Commercial Banking, Tier 1 Auto, Political, Hospitals, and Medical Offices.
Click gray circle to enlarge chart.
For more information from BIA Advisory Services.


.png)


